
Analytics are important as they provide insight into your website visitors, customers, and your business. In this blog, I would share some practical tips that you can easily set up and get a quick snapshot of your online shop business—without having to be a Google Analytics pro.
When launching the online shop, you need to make sure the analytics tracking is in place. If you use Shopify, it does have some built-in analytic reporting. However, I usually recommend my clients to also install some third-party tracking tools. Google Analytics is one of the most well-known, popular, and most importantly, free analytics tools that every business should make good use of.
There is a learning curve for Google Analytics, fortunately, Google provides a lot of free resources online that you can equip yourself with the necessary knowledge. This would take time and practice to get familiar with the tool and build the custom reports for your very business. Don’t be intimidated, I would share with you some easy-to-set reports, that you can get a quick snapshot of what is working and what isn’t.
To Start: Enhanced Ecommerce Report
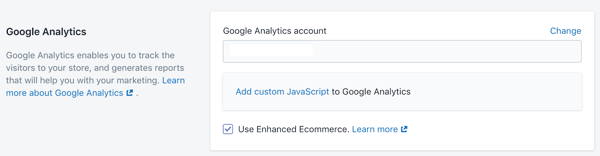
Firstly, you would need to install the Google Analytics code. For Shopify, it is very straightforward, just input the GA account code under ‘Online Shop > Preference’. Please also tick the ‘use enhanced eCommerce’ to enable the enhanced eCommerce report, which enables a lot of insightful and actionable reports for online shops.
In the eCommerce report, you can see three categories of the metrics related to your online business: Transactional metrics like the total number of orders, the Average Order Value (AOV), Average Quantity (number of products per transaction), Revenue metrics like total Revenue of your ecommerce transactions (this includes tax and shipping), your eCommerce Conversion Rate, as well as Marketing metrics, like the number of transactions, the revenue, and the average order value generated by different campaigns, coupon codes or affiliate channels.
Five Google Analytics Report for Extra Insight
With the enhanced eCommerce function enabled, now you can take only a few seconds to set up the below 5 simple analytics reports providing you with the extra insight into your online businesses.
1. Customer Acquisition report
The Customer Acquisition report shows how your customers find your online shop, and which channels contribute the most revenue to your business.
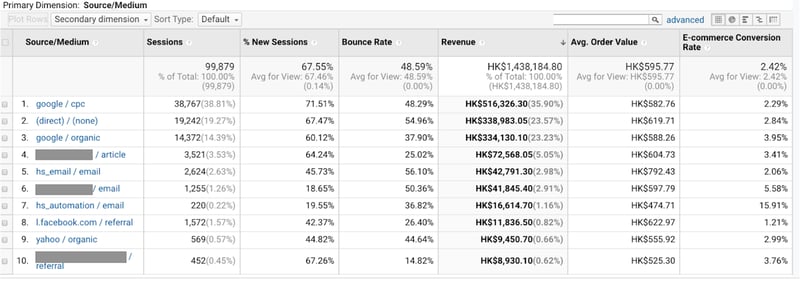
You can find the breakdown of total revenue, average order value, and conversion rate by each marketing channel. This allows you to identify what specific channels you should consider to increase (or decrease) the effort and budget. For example, you can see in the above report screen, Google CPC brought the most revenue among all the marketing channels, with the average order value around HK$ 600. Then you can calculate and modify the Return on ad spend (ROAS) to further adjust the investment and optimize the performance.
2. Organic Traffic Landing Page report
SEO is critical (link to previous SEO blog article), as it is the most sustainable traffic source. Google does not share the search query that people used to find your website to avoid the abuse of keyword.
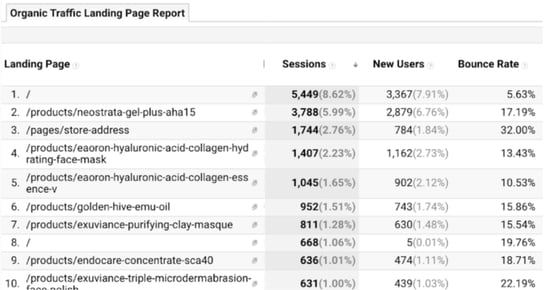
But in this organic traffic landing page report, you can find which are your top-performing landing pages for organic traffic. This actually gives you the insight of which keywords and pages you should prioritize for SEO.
3. Time of Day Report
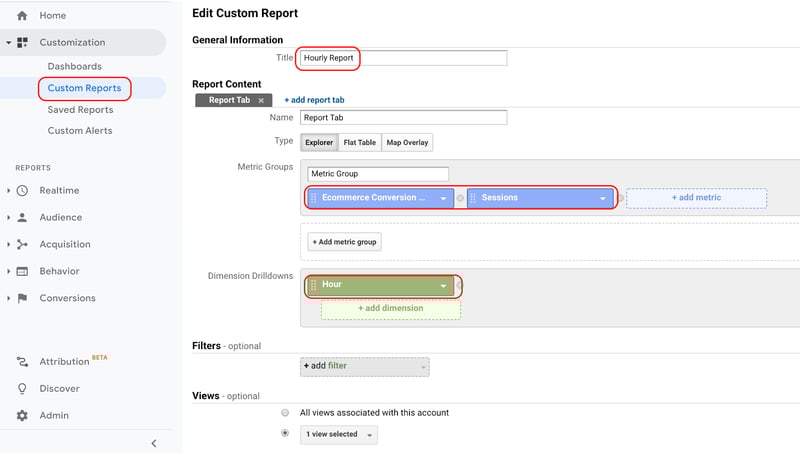
What time your online shop gets the most traffic? What time your website converts the best? This valuable data is being collected in your Google Analytics account, but it is not available but very easy to pull it out. The ‘Time of Day’ report allows you to have access to this data at a granular level. To set up, you can add a “+ New Custom Report” from the “Customisation” tab and set up a new custom report with ‘eCommerce conversion’ and ‘Session’ in the metric field and “Hour” in the dimension drill-down.
Now you can see a graph and a data table with the number of sessions throughout the day.
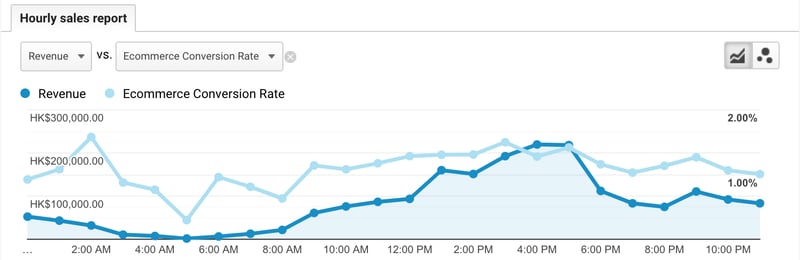
Taking the above graph as an example. The traffic peaks around 4-5 pm, and the conversion rate is also at the high range. Then you can consider blasting out the special promotional offer message around 3-4 pm to draw the biggest number of visitors. Also, as you could notice the conversion rate peaks at 1-2 am at midnight, it would be better to extend your promotion offer 2 hours after midnight to create a last-minute rush of sales.
4. Day of Week Transaction report
Day of Week report helps you to identify which days of the week lead to the highest level of sales.
Our experience for the Hong Kong market, weekdays has higher traffic over weekends. However, depending on the product category you are selling, the peak of the conversion rate varies. Instead of using assumptions, you can have clear evidence to prove them by running this report.
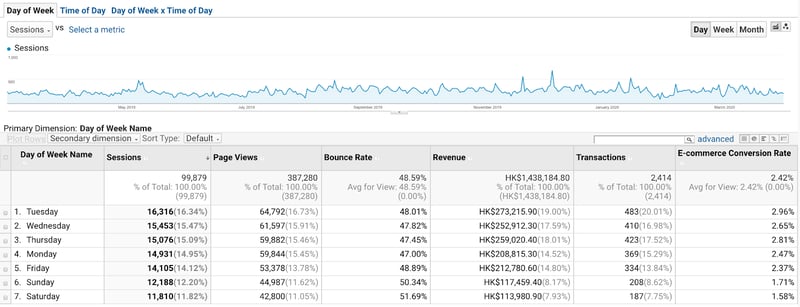
From the above report screen, you can find Tuesday has the highest traffic, revenue, as well as the conversion rate. Based on this valuable information, I recommend the client send the brand newsletter on Tuesday to maximize the performance; and promotional messages should not be announced during weekends.
5. Device Comparison report
The Device Comparison report allows you to better understand the differences between your mobile and desktop customers. You will also have a clear picture of what acquisition sources are driving the most profitable customers based on the device. To see what percentage of your users are on mobile devices, open up the Audience tab, and select Mobile and Overview. You can also add the ‘Secondary dimension’, for example by adding media as the secondary dimension.
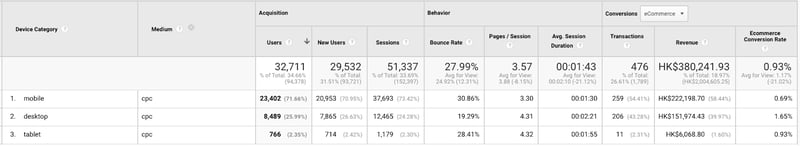
You will find that although mobile CPC traffic contributes the most, the conversion rate is much higher for the CPC traffic on desktop. So you can consider adjusting keyword bidding for desktop by Enhanced cost-per-click (ECPC), which helps you to capture more traffic from desktop searchers and get more conversions.
Summary
Google Analytics reports are one of the most powerful tools for online business. The above-shared reports are simple versions. If you want to learn more, feel free to drop us a line. Our eCommerce and digital marketing experts would connect with you and share the tips to boost your online sales!